
Movie Industry Study
Author: Kamile Yagci
Overview
In this project, I have analyzed the Movie Industry. The Microsoft decided to open a new studio and is exploring what types of films are currently doing the best at the box office. The results of this study will advise Microsoft on making business decisions.
Business Problem
I have studied the four questions in order to determine the most profitable approach in movie making:
- Is there a correlation between the production budget and the profit?
- Is there a correlation between the ratings and the profit?
- Which directors, writers, actors and actresses make the most profit?
- Which genres make the most profit?
Data
Based on the selected Business Problems, I used the data from IMDB and The Numbers in the analysis.
The data files are:
- tn.movie_budgets.csv.gz
- imdb.title.basics.csv.gz
- imdb.title.ratings.csv.gz
- imdb.title.principals.csv.gz
- imdb.name.basics.csv.gz
Method
Part I
-
Explore all the provided Movie Industry Data Files from IMDB, The Numbers, Rotten Tomatoes, Box Office Mojo, TheMovieDB.
-
Determine the Business Questions.
-
Select which Data Files to be used in the Analysis: 5 data files selected from IMDB and The Numbers.
-
Merge Data into one DataFrame.
-
Clean Data.
-
Define Profit.
-
Save the created DataFrame into a a new data file.
Part II
- Analyse Business Question 1: Is there a correlation between the production budget and the profit?
- Filter data for Question 1 & 2
- Data Visualization and Correlation Calculation: Scatter Plots for ‘Profit vs Production Budget’ and ‘Profit Rate vs Production Rate’
- Detailed look at the ‘‘Profit vs Production Budget’ at different budget ranges: Data Visualization, Correlation and Median profit Rate.
- Analyse Business Question 2: Is there a correlation between the ratings and the profit?
- Data Visualization and Correlation Calculation: Scatter ‘Profit vs Average Rating’ and ‘Profit Rate vs Average Rating’.
- Analyse Business Question 3: Which directors and writers make the most profit?
- Filter data specifed for Question 3
- Select the high budget movies (production_budget > $100,000,000).
- Find Most Profitable Directors
- Data Visualization: Bar Graphs for Median Profit and Median Profit Rate. Top names will be displayed only.
- Find the intersection of the names on the two lists/bar graphs: Profit and Profit Rate.
- Find Profitable Writers
- Find Profitable Actors
- Most Profitable Actresses
- Analyse Business Question 4: Which genres make the most profit?
- Filter data specifed for Question 4.
- Select the high budget movies (production_budget > $100,000,000). This selection is based on the analysis for Question 1.
- Data Visualization: Bar Graphs for Median Profit and Median Profit Rate.
- Visually determine the most profitable names based on two bar graphs: Profit and Profit Rate.
Part III
-
Repeat the analysis for Question 3 ‘Most profitable directors, writers, actors and actresses’ for Movies with Medium Budget ($20,000,000 < production_budget > $100,000,000).
-
Repeat the analysis for Question 4 ‘Most profitable genres’ for Movies with Medium Budget ($20,000,000 < production_budget > $100,000,000).
Analysis and Results
Merge, Clean and Save Data
The data from five files is combined into one data frame.
The data is cleaned as follows: * Remove the unnecessary columns * Remove rows with $0 worldwide_gross * Change the currency columns to float * Seperate genres * Slice the release year from the release date


The data Frame is saved into a a new data file ‘myData.csv’. This is the only data file to be used for the analysis.
Profit Rate Definition
My analysis and business questions focus on the factors affecting the profit in movie industry. Therefore, it is crucial to have a good definition of the profit. Instead of using only one profit definition, I chose to explore two definitions:
- Profit: profit_gross = worldwide_gross - production_budget
- Profit Rate: profit_rate = worldwide_gross / production_budget
In this study, for each business question, I will look at both ‘Profit’ and ‘Profit Rate’ distributions.
Q1: Is there a correlation between the production budget and the profit?
The subset of data is created with the selected/required columns for Question 1 and Question 2.
Data is Filtered with specifed cuts for Question 1 & 2: * Remove duplicate movies. * Remove old movies with release year before 1990; focus on past 30 years. * Remove outlier movies with very low budget (<$10,000,000) and very high profit rate (>30).
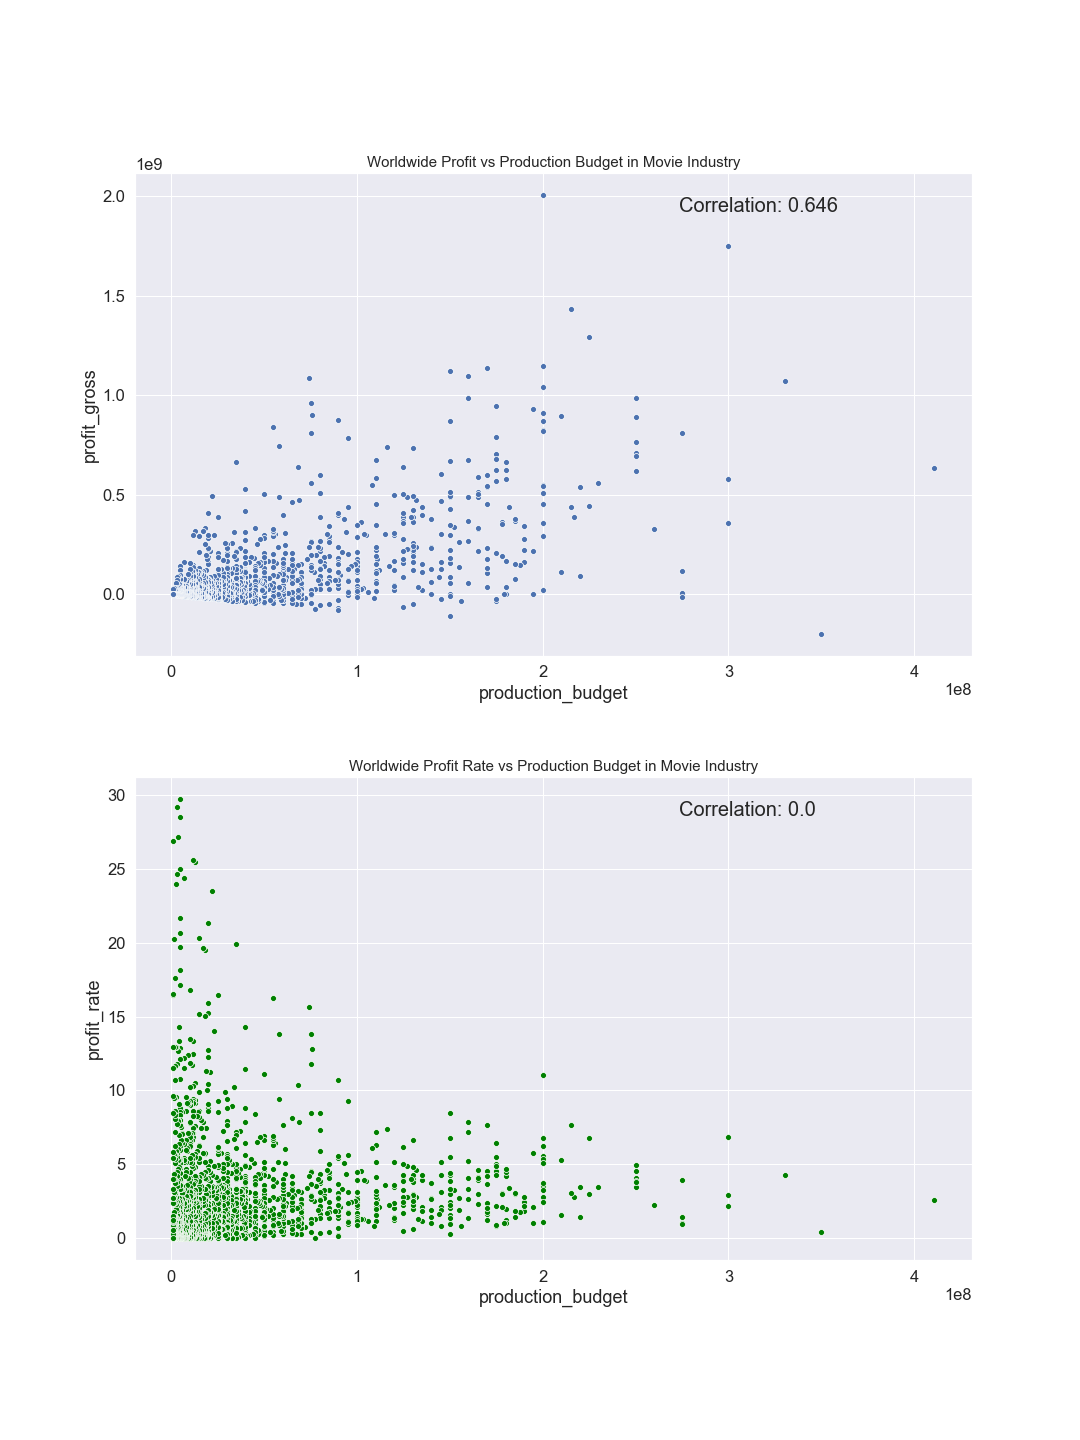
In order to understand the effect of prdoduction budget, I plotted the scatter graphs for both profit and profit rate. Then, I have calculated the correlation for each distribution. The correlation values are displayed on the plots.
- As expected and observed on the plot (top), there is a high correlation between the production budget and profit.
- The correlation between production budget and profit rate is almost zero (bottom plot). The shape of the distribution varies in different budget ranges, the correlation might be different, too. Therefore, it is better to look at the profit rate distributions in zoomed budget ranges.
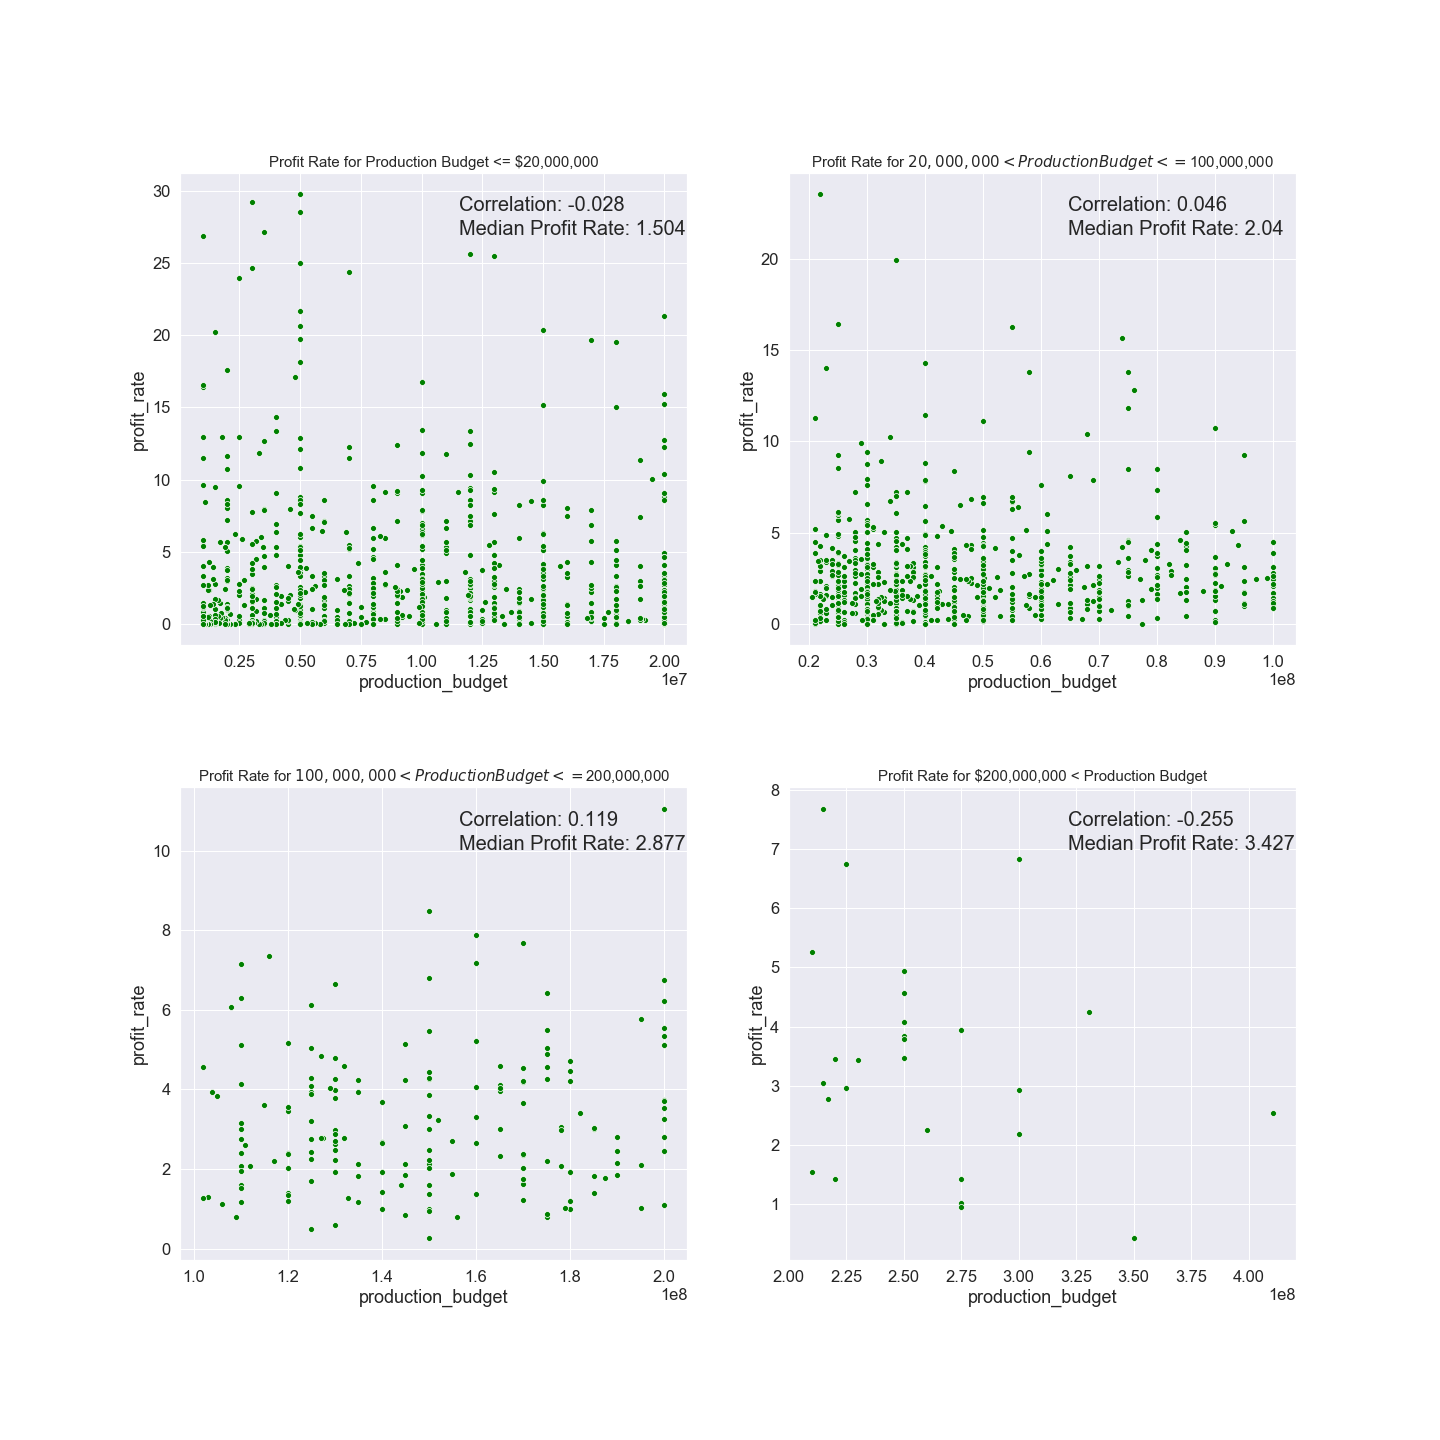
The production budget is divided in 4 ranges, and scatter graphs are plotted for all. The median profit_rate is calculated and displayed on the graphs in addition to the correlation values.
- Low budget: production_budget <= $20,000,000 (top left): Almost zero correlation. Small median profit rate. Investment not recommended.
- Medium budget: $20,000,000 < production_budget <= $100,000,000 (top right): Almost zero correlation. Acceptable profit rate. Investment is recommended.
- High budget: $100,000,000 < production_budget <= $200,000,000 (bottom left): Some positive correlation exists. Good, stable profit rate. Highly recommended for investement.
- Very high budget: production_budget > $100,000,000 (bottom right): Negative correlation. Median profit rate is high. There is a likelihood that profit rate will decrease as the budget increases. The risk is high on this investment. The uncertinity in the analysis for this budget range is high due to the small data available.
Q2: Is there a correlation between the ratings and the profit?
The filtered data Frame created for Question is used for Question 2.
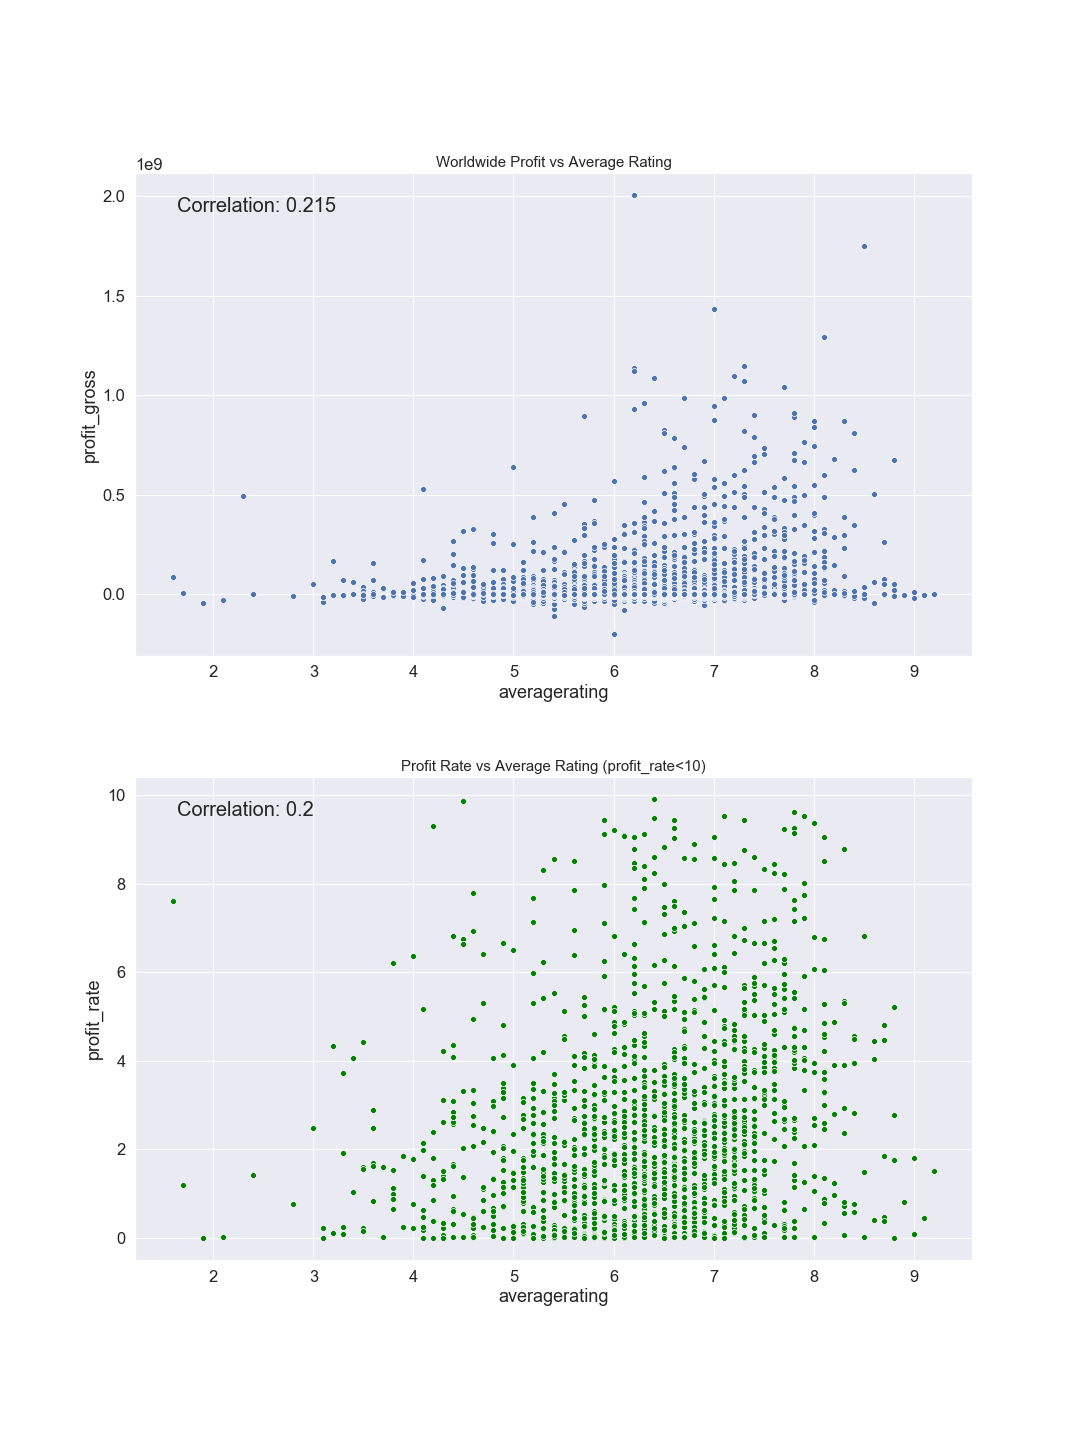
The below scatter plots show the profit versus average rating (top) and profit_rate versus average rating (bottom). There is good correlation between average rating and profit/profit_rate. However, after rating 8, the profit and profit rate drops. The left plot shows that, many high rating movies bring low profit, they are probably low budget movies. According to the right plot, the profit_rate is also low for the high rating movies.
From profit point of view, I recommend to aim for making movies with average rating between 6 and 8.
Q3: Which directors, writers, actors and actresses make the most profit?
The subset of data is created with the selected/required columns for Question 3.
Data is Filtered with specifed cuts for Question 3: * Remove duplicate movies. * Remove old movies with release year before 1990; focus on past 30 years. * Remove the names of the deceased people.
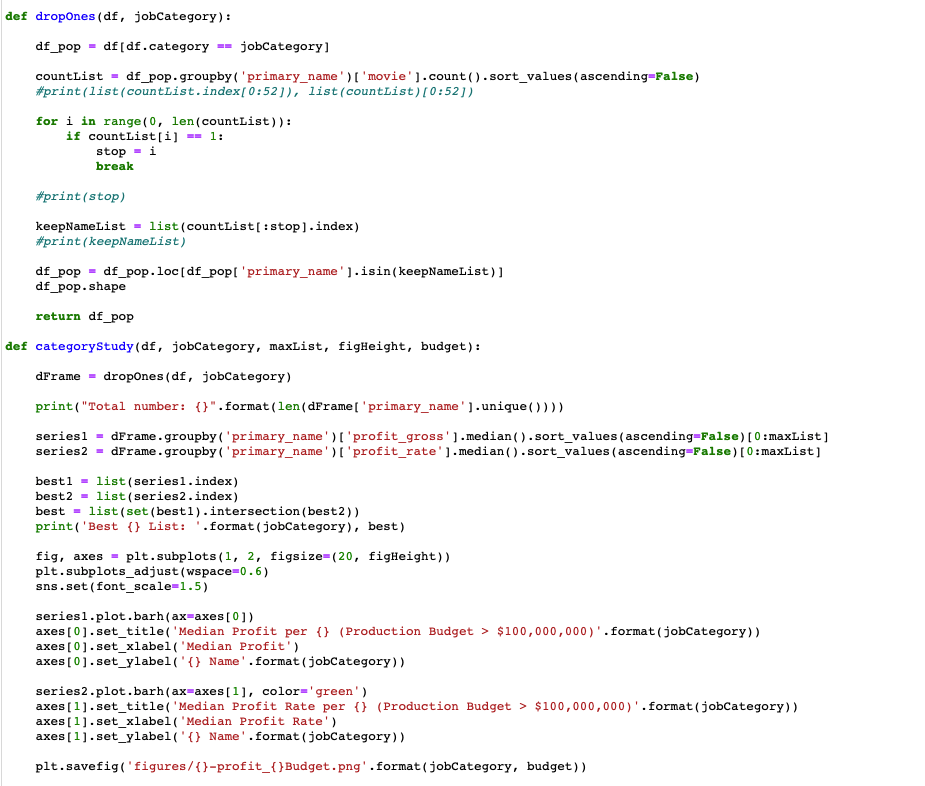
I have created two functions to determine the most profitable names in the selected category. These functions are stored in a seperate .py file.
These functions: * Remove the names with less than 2 movies * GroupBy names and calculate the median Profit and median Profit Rate * Data Visualization: Bar Graphs for Profit and Profit Rate. Top names will be displayed only. * Find the intersection of the names on the two lists/bar graphs: Profit and Profit Rate.
For Business Questions 3 and 4, I have analyzed the movies in two seperate budget ranges:
- High budget: production_budget > $100,000,000
- Medium budget: $20,000,000 < production_budget <= $100,000,000
High Budget Movies (production_budget > $100,000,000)
Directors
Call functions to run analysis for directors:

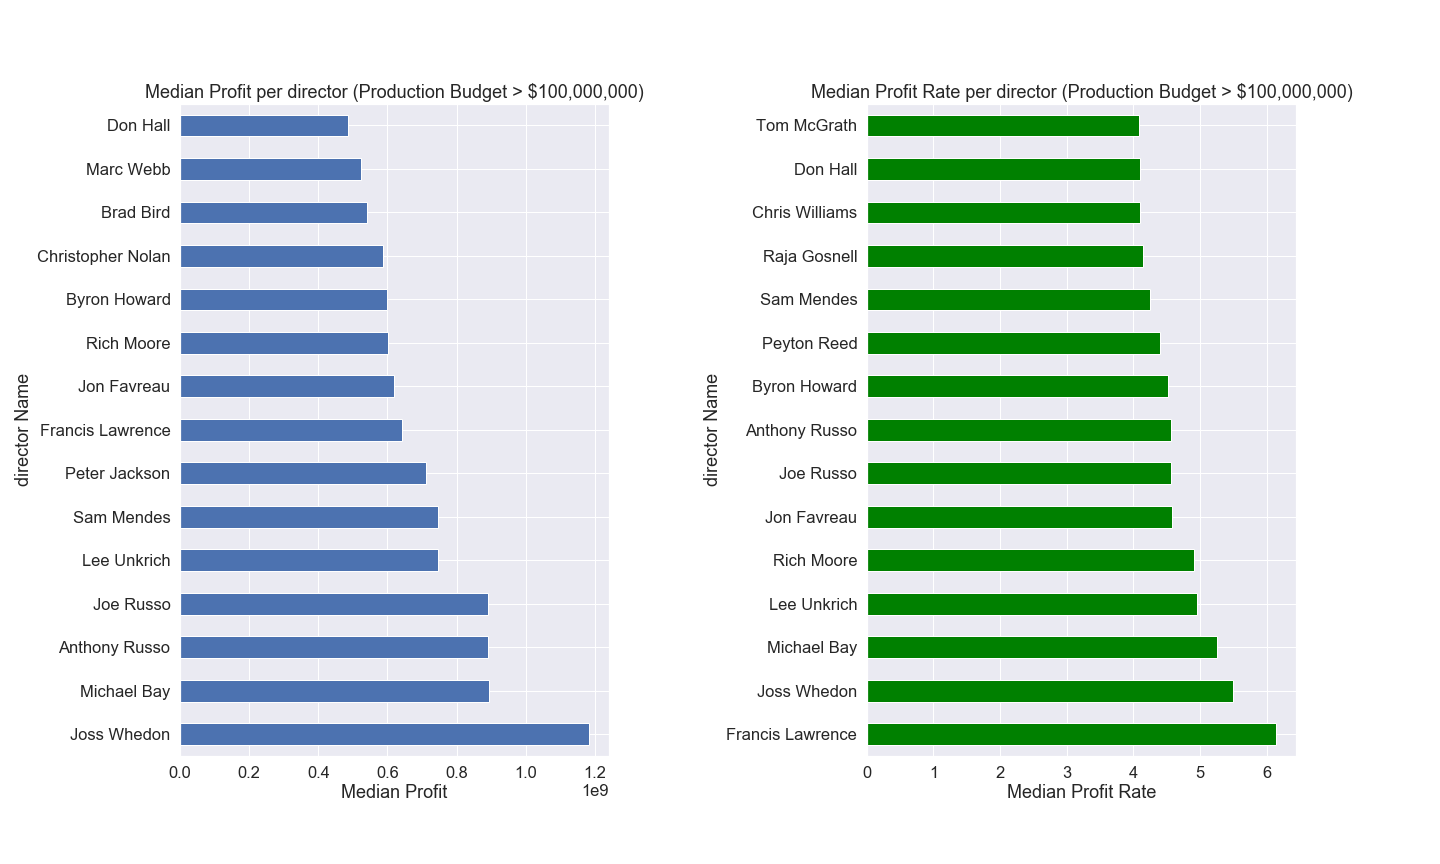
The figure below displays the bar graphs for the top directors based on profit (left) and based on profit_rate (right) for high budget movies.
For this analysis, I declare that the intersection of these two bar graphs is the list of the most profitable directors.
Most profitable directors: ‘Lee Unkrich’, ‘Michael Bay’, ‘Jon Favreau’, ‘Rich Moore’, ‘Anthony Russo’, ‘Sam Mendes’, ‘Joe Russo’, ‘Byron Howard’, ‘Joss Whedon’, ‘Francis Lawrence’, ‘Don Hall’
Writers
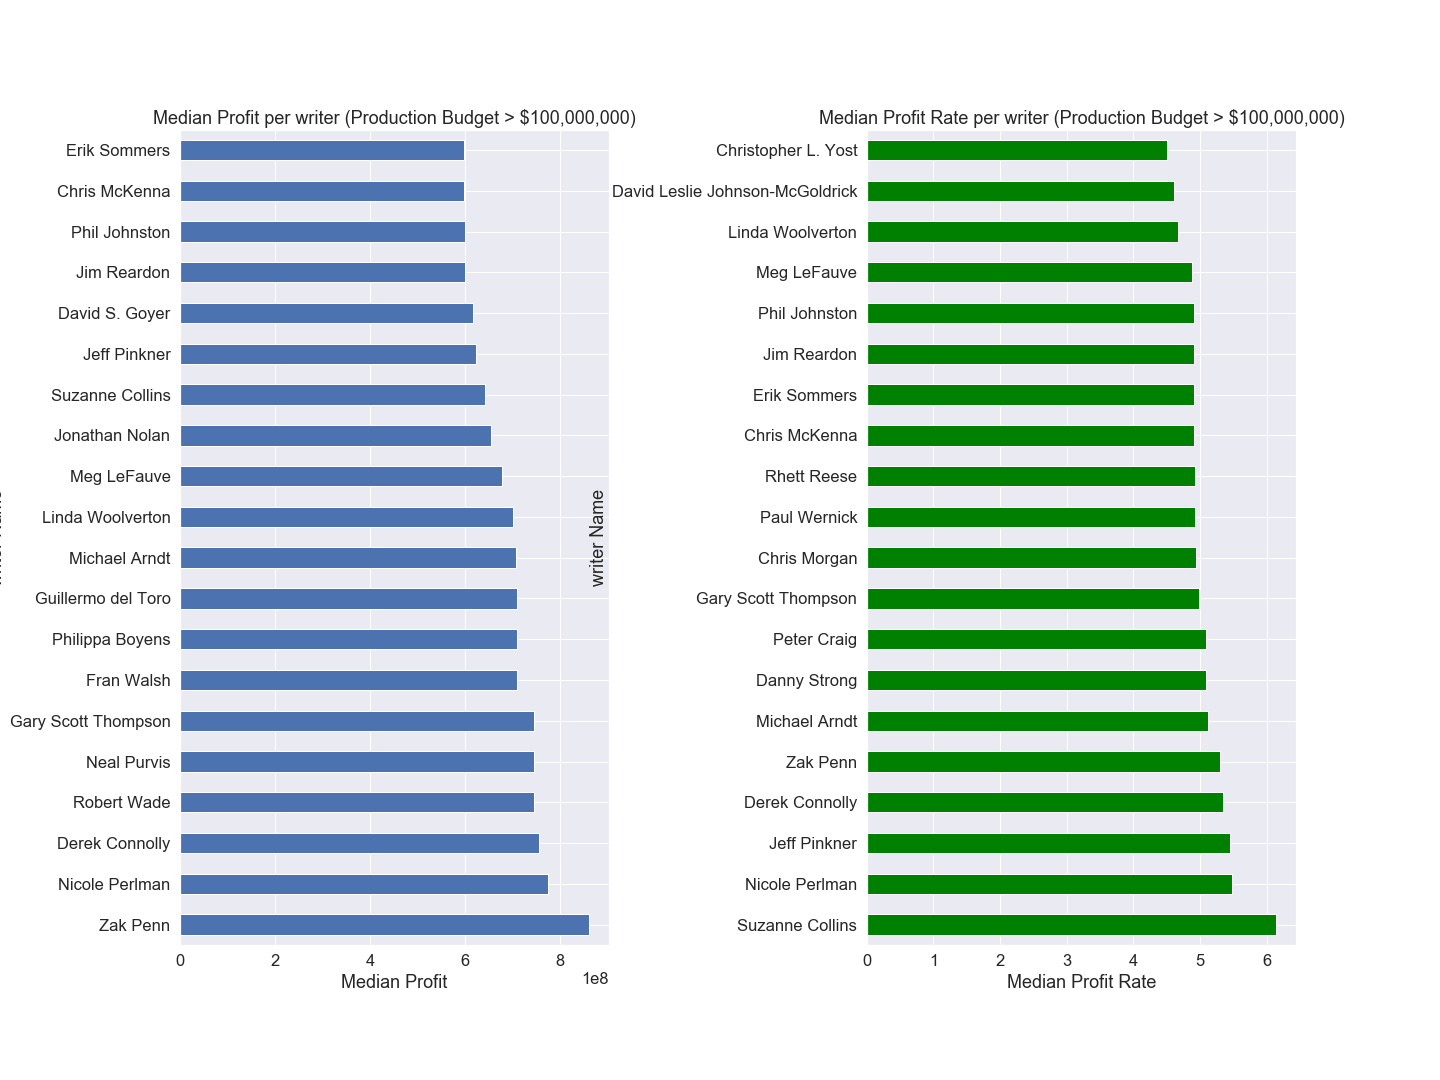
The figure below displays the bar graphs for the top writers based on median profit (left) and based on median profit_rate (right) for high budget movies.
Most profitable writers: ‘Linda Woolverton’, ‘Phil Johnston’, ‘Gary Scott Thompson’, ‘Meg LeFauve’, ‘Jim Reardon’, ‘Nicole Perlman’, ‘Jeff Pinkner’, ‘Erik Sommers’, ‘Chris McKenna’, ‘Derek Connolly’, ‘Suzanne Collins’, ‘Zak Penn’, ‘Michael Arndt’
Actors
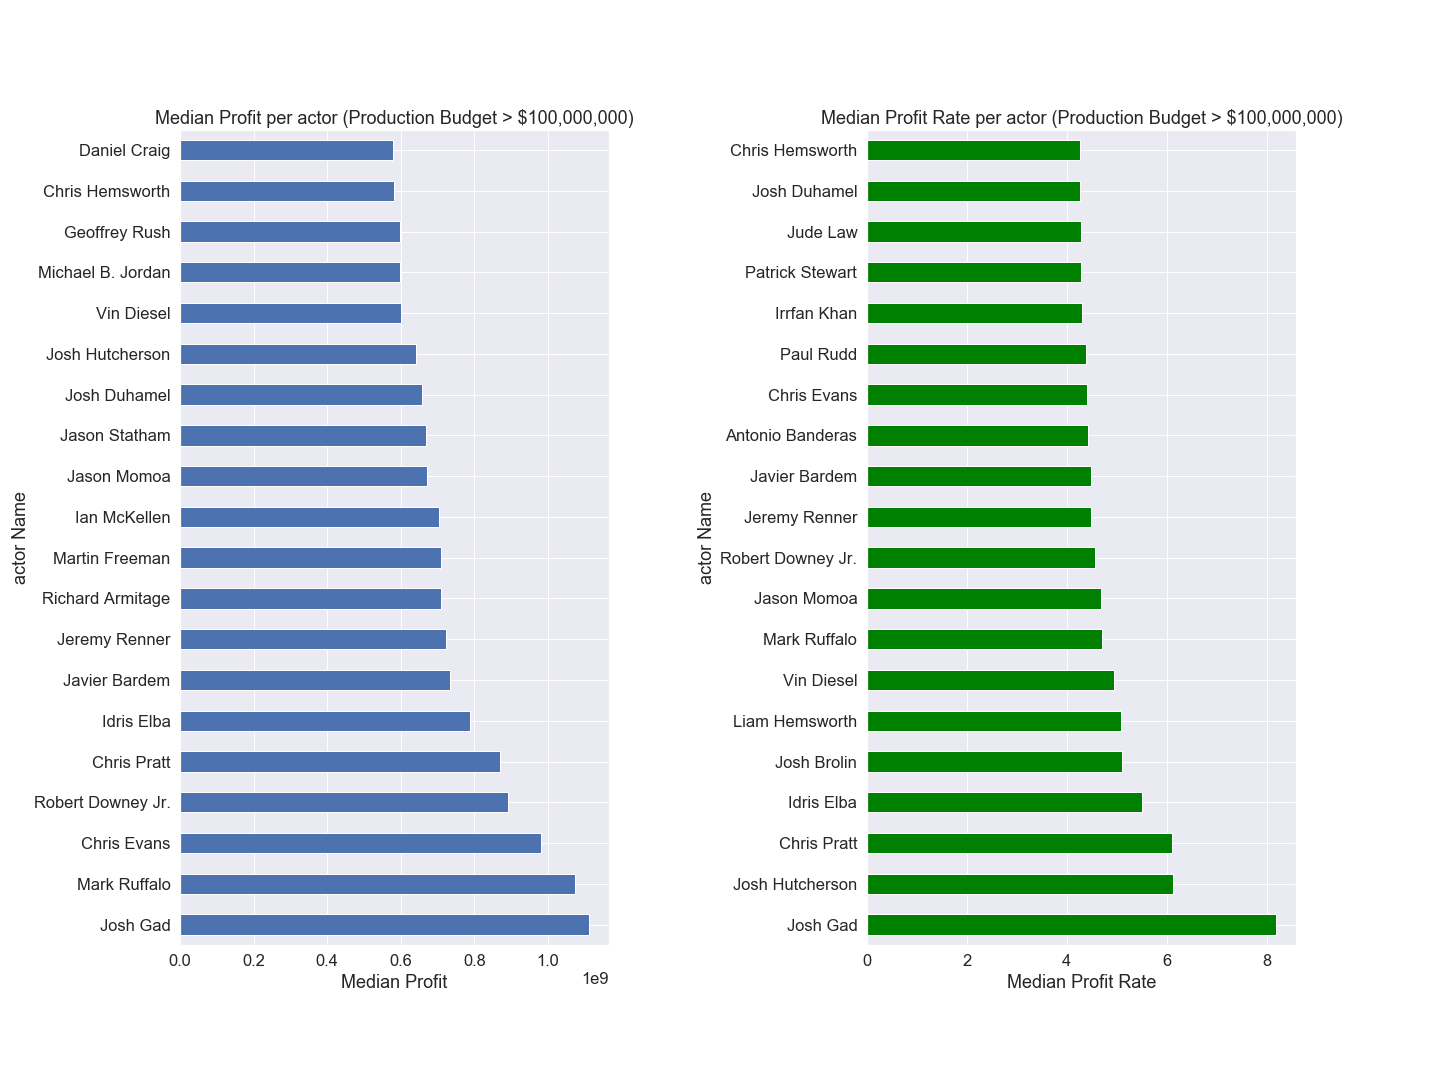
The figure below displays the bar graphs for the top actors based on profit (left) and based on profit_rate (right) for high budget movies.
Most profitable actors: ‘Josh Duhamel’, ‘Vin Diesel’, ‘Mark Ruffalo’, ‘Chris Hemsworth’, ‘Josh Gad’, ‘Robert Downey Jr.’, ‘Javier Bardem’, ‘Chris Evans’, ‘Idris Elba’, ‘Josh Hutcherson’, ‘Chris Pratt’, ‘Jason Momoa’, ‘Jeremy Renner’
Actresses
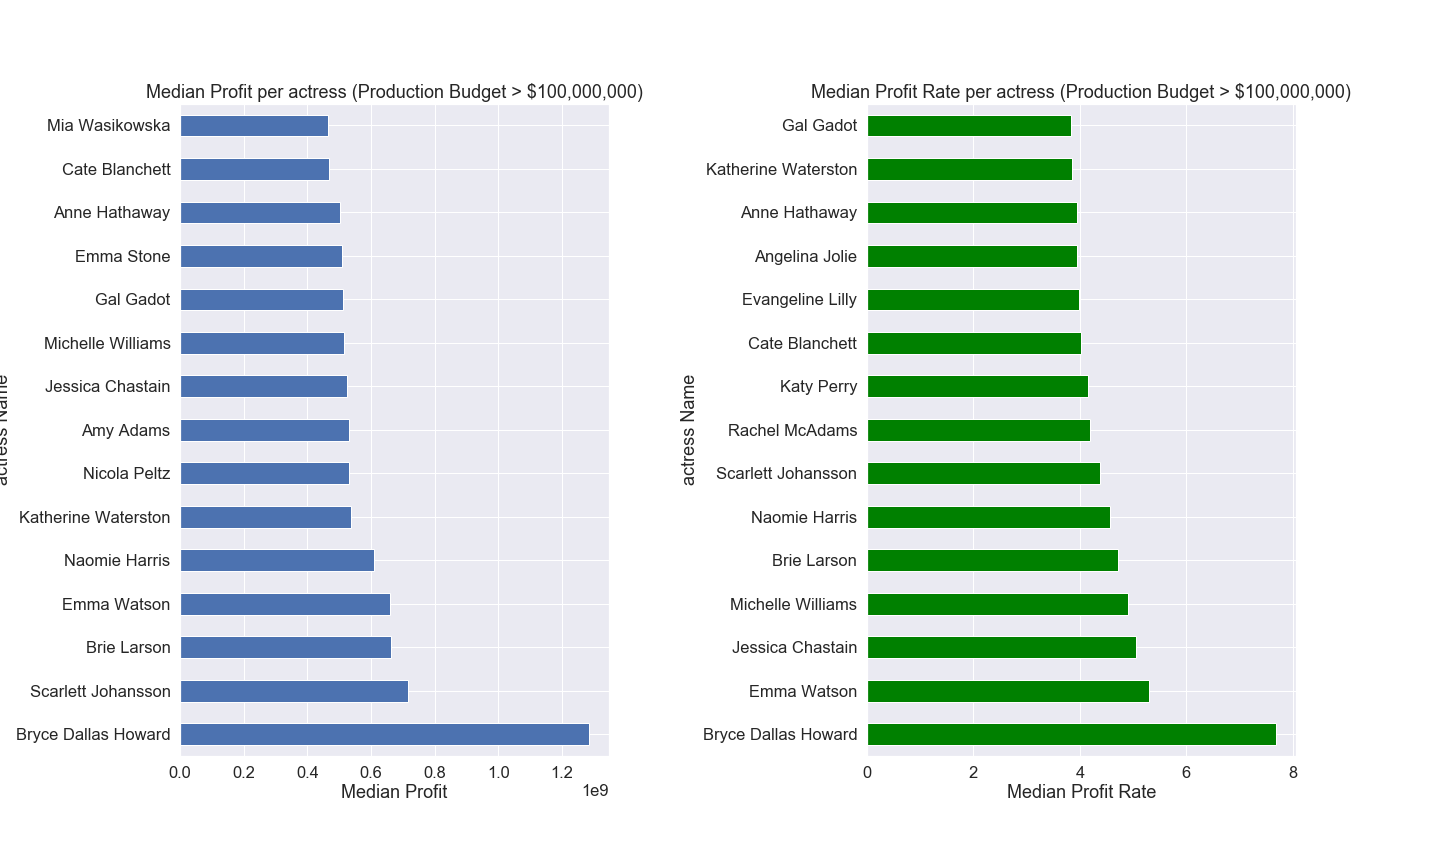
The figure below displays the bar graphs for the top actresses based on profit (left) and based on profit_rate (right) for high budget movies.
Most profitable actresses: ‘Katherine Waterston’, ‘Emma Watson’, ‘Gal Gadot’, ‘Scarlett Johansson’, ‘Anne Hathaway’, ‘Jessica Chastain’, ‘Naomie Harris’, ‘Bryce Dallas Howard’, ‘Michelle Williams’, ‘Cate Blanchett’, ‘Brie Larson’
Medium budget Movies: ($20,000,000 < production_budget <= $100,000,000)
Similar study made for the medium budget movies. Profitable directors, writers, actors and actresses are determined for the medium budget range.
Directors: ‘Chris Renaud’, ‘Christopher Miller’, ‘Genndy Tartakovsky’, ‘Kyle Balda’, ‘Pierre Coffin’, ‘James Foley’, ‘Steve Martino’, ‘Jake Kasdan’, ‘Phil Lord’, ‘Paul Feig’, ‘Olivier Megaton’
Writers: ‘Ken Daurio’, ‘Stephenie Meyer’, ‘Kevin Hageman’, ‘Dan Hageman’, ‘Erik Sommers’, ‘Cinco Paul’, ‘Wellesley Wild’, ‘Anthony McCarten’, ‘Brian Lynch’, ‘E.L. James’, ‘Robert Mark Kamen’, ‘Craig Mazin’, ‘Alec Sulkin’, ‘Billy Ray’, ‘Chris McKenna’, ‘Niall Leonard’
Actors: ‘Eric Johnson’, ‘Jamie Dornan’, ‘Michael Keaton’, ‘Taylor Lautner’, ‘Eric Stonestreet’, ‘Aziz Ansari’, ‘Neil Patrick Harris’, ‘Bradley Cooper’, ‘Thomas Brodie-Sangster’, “Dylan O’Brien”, ‘Seth MacFarlane’, ‘Andy Samberg’, ‘Benjamin Bratt’, ‘Marwan Kenzari’, ‘Ed Skrein’, ‘Denis Leary’
Actresses: ‘Ali Larter’, ‘Hailee Steinfeld’, ‘Jennifer Lawrence’, ‘Dakota Johnson’, ‘Eloise Mumford’, ‘Sandra Bullock’, ‘Jennifer Ehle’, ‘Kristen Wiig’, ‘Miranda Cosgrove’, ‘Famke Janssen’, ‘Selena Gomez’
Q4: Which genres make the most profit?
The subset of data is created with the selected/required columns for Question 3.
Data is Filtered with specifed cuts for Question 4: * Remove duplicate movies. * Remove old movies with release year before 1990; focus on past 30 years.
The data is GroupBy ‘Genres’ with Median aggregiation.

However, some of the genres have few number of movies listed. These genres are removed from the data for healtier result.
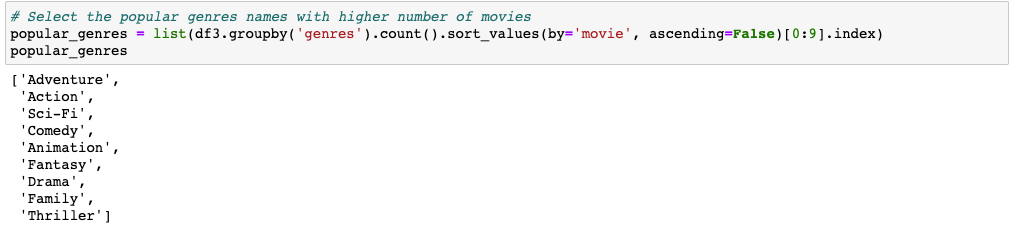

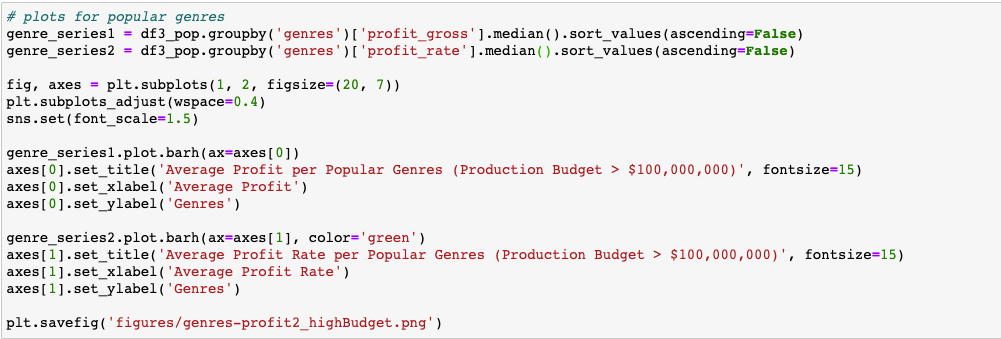
Bar Graphs for Profit and Profit Rate are drawn for common genres with at least 10 entries.
For Business Questions 4, I have analyzed the movies in two seperate budget ranges:
- High budget: production_budget > $100,000,000
- Medium budget: $20,000,000 < production_budget <= $100,000,000
High Budget Movies (production_budget > $100,000,000)
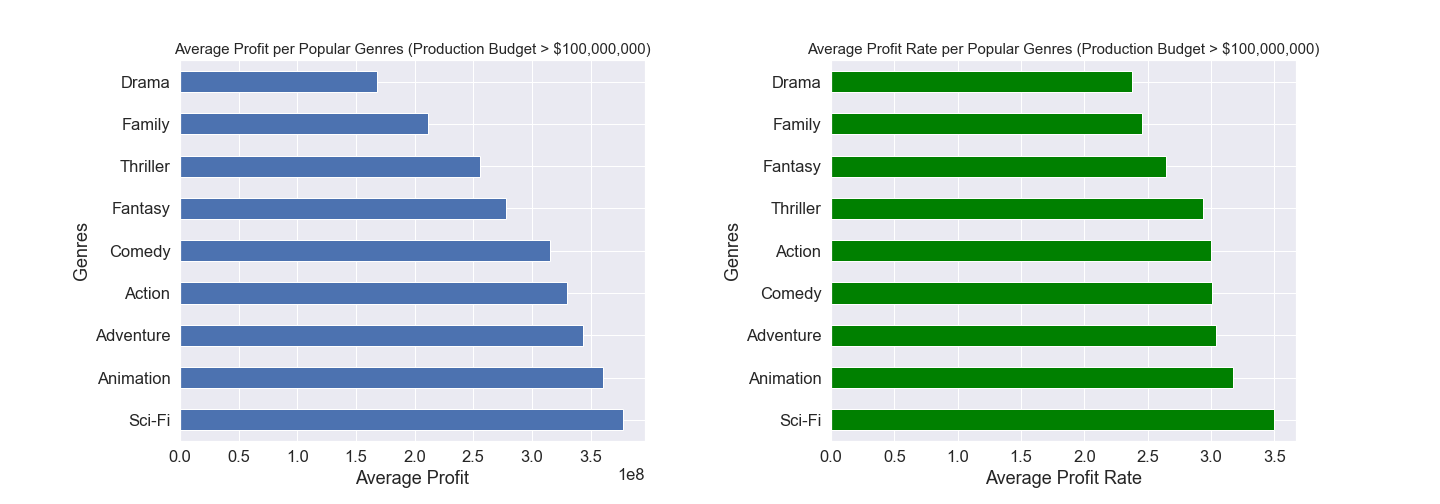
The bar graphs below compares the most common genres for median profit (left) and for median profit_rate (right) for high budget movies.
I visually determined the most profitable genres based on two bar graphs: Profit and Profit Rate.
Most profitable genres for High Budget: Sci-Fi, Animation, Adventure, Comedy, and Action
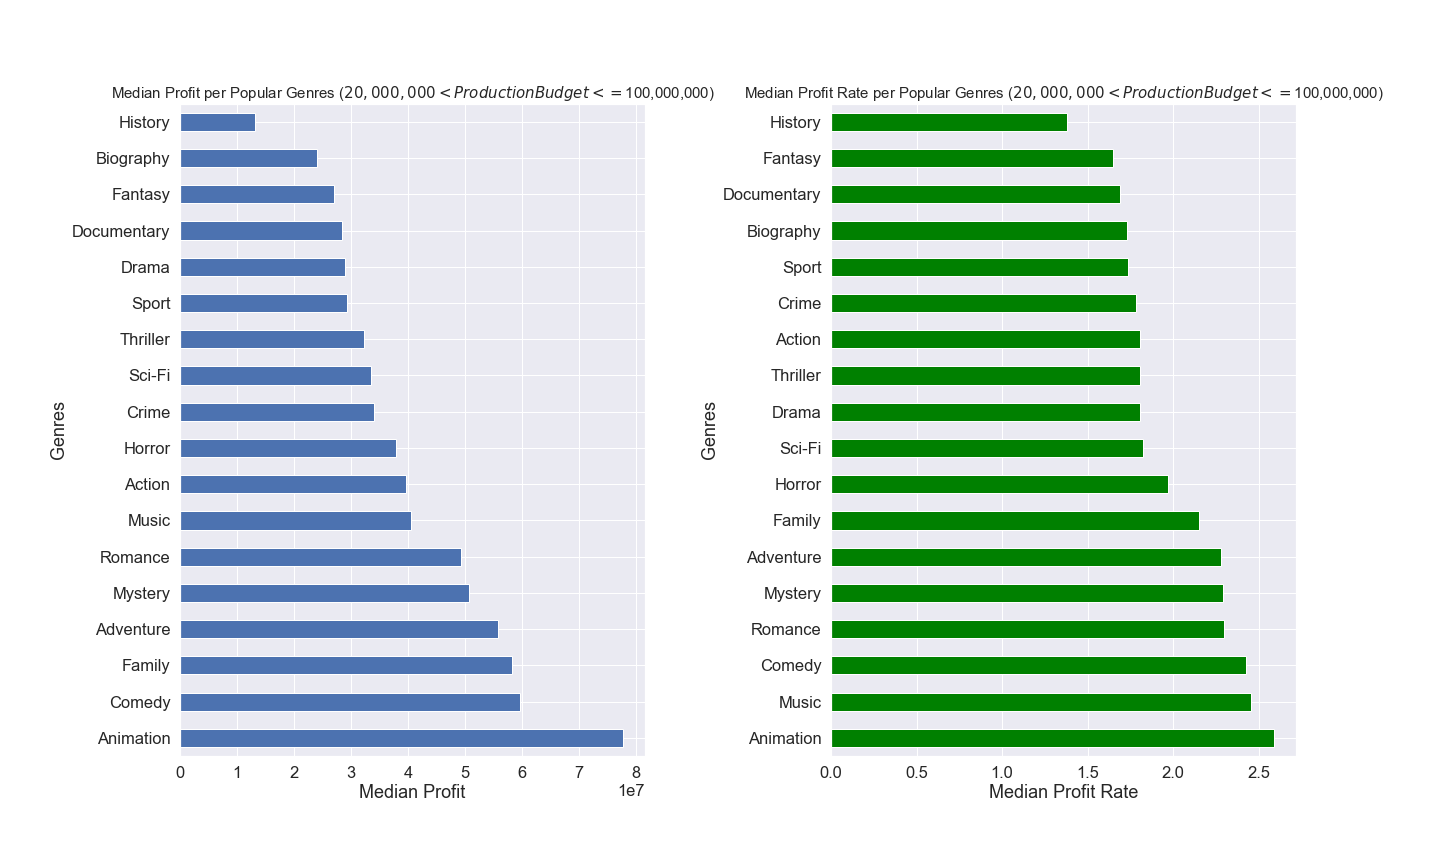
Medium budget Movies: ($20,000,000 < production_budget <= $100,000,000)
Similar study made for medium budget movies.
Profitable Genres for Medium Budget: Animation, Music, Family, Comedy, Adventure
Conclusion
Here are my business recommendations in movie making for the most profit:
- Invest on movies with production budget between $100,000,000 and $200,000,000.
- Aim for making movies with average rating between 6 and 8.
- Hire the listed directors, writers, actors and actresses for the movies in the recommended budget range. See Analysis and Result Section, Question 3.
- Invest on Sci-Fi, Animation, Thriller, Adventure movies for the recommended budget range.
The movies with medium production budget, $20,000,000 and $100,000,000, are acceptable for investment. For these movies, the profitable directors, writers, actors and actresses are different. The profitable genre for the medium budget range is also different than high budget range. Follow the budget specific recommendations in Analysis and Result Section, Question 3 an 4.
Future Work
- Repeat the analysis in more budget ranges: $10,000,000 - $50,000,000 - $100,000 - $200,000,00 - up.
- Study the most profitable directors, actors, actresses and actors for each genre seperately.
- This study used the data of the movies after 1990. Repeat the study for the movies after 2000, even though it will cause the reduction of the entries and increase the standard deviation in the results.